Introduction
In December 2022, and again in January 2024, we at the National Endowment for Financial Education (NEFE) surveyed a nationally representative sample of U.S. adults to assess their self-reported financial well-being using the short-form version of the Consumer Financial Protection Bureau’s (CFPB) Financial Well-Being Scale. Financial well-being is a dynamic and highly personal concept that includes factors such as an individual’s ability to manage their current financial situation, how much control they feel they have over their finances, and their hopes for their financial future. Additional factors that influence financial well-being include one’s family or cultural values related to money and finances, their socioeconomic status and lived experience, structural barriers to full participation in the economy, as well as their access to the information and education that supports making informed financial decisions. NEFE’s Personal Finance Ecosystem offers a helpful visual representation of how these and other factors contribute to an individual’s experience of their financial well-being. In the December 2022 and January 2024 surveys, as well as a survey fielded in December 2021, respondents were also asked how they rate the quality of their current financial life, providing a more subjective view of their finances, and these data are presented here.
The short-form version of the scale is composed of five questions and includes two additional questions to assist with scoring. Respondent answers are converted into a single score ranging from zero to 100, with higher scores indicating higher financial well-being. The CFPB’s analysis of data from the first national survey of financial well-being using the scale resulted in six groups of scores ranging from “very low” to “very high.”
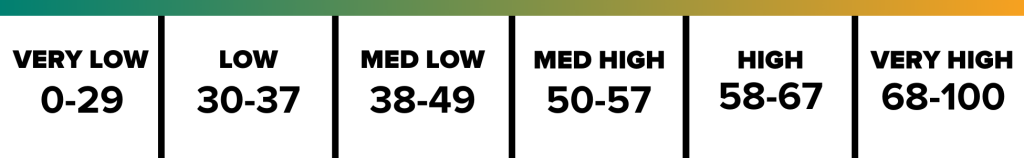
Source: Financial Wellbeing in America, CFPB 2017
Financial Well-Being Scores: December 2022 – January 2024
Our analysis of the data suggests that average financial well-being scores across the US population are quite stable. However, we do see notable differences in average financial well-being scores between different levels of educational attainment and household income within each year, and those differences remain consistent across time with little change from late 2022 to early 2024. Respondents with higher incomes, and higher education were more likely to have higher financial well-being scores, but there is no statistically significant change within these groups over the years surveyed.
Financial well-being scores between respondents of different racial and ethnic identities are also stable across waves of the survey. For example, Latinx/Hispanic respondents have the lowest mean financial well-being scores (51 and 50 respectively) for both years, compared to the overall sample average of 52, but no changes within a racial or ethnic group between December 2022 and January 2024 were statistically significant.
Financial well-being scores are a fairly consistent measure for overall financial well-being. We do not see large swings between years for any demographic, despite significant changes in macroeconomic conditions that likely influence how people feel about their finances.
Financial Well-Being and Quality of Financial Life
In contrast to the relative stability we saw in respondent well-being scores, respondents’ self-reported quality of financial life varied considerably more across socio-demographic characteristics as well as over time. An individual may have markers that indicate high financial well-being but feel themselves that their financial life is in fact worse than they expected it to be, which can cause additional stress that may not be expected based on their financial well-being score.
Similarly, an individual may not have the best markers for strong financial well-being, but they are better off than they expected they would be at this point in their life, so they are not stressed about things that one might expect them to. An individual’s perceived quality of financial life often has the biggest impact on financial stress, which is known to have a direct impact on health. Since everyone has different expectations for their own financial lives, asking directly how they feel about the quality of their financial lives adds an additional layer of nuance that is essential in grasping a person’s overall financial well-being. More simply, where the CFPB’s Financial Well-Being Scale offers a stable measure of subjective well-being, asking respondents more directly how they rate the quality of their financial life yields an additional layer of insight, often influenced by how individuals are feeling about their finances at that time.
Respondent mean financial well-being scores differed significantly depending on their self-perceived quality of financial life, ranging from an average of 39 among those who reported a financial life that was “worse than expected,” to 64 among those who said it was “better than expected.” These differences remained stable between December 2021 and January 2024. A strength of the CFPB’s well-being scale is its ability to capture a practical, material element of individual financial circumstances as well as the diversity of perceptions or assessments that different people bring to their financial lives. It is unsurprising that a more forthright question about one’s perception of their financial life relative to their aspirations or expectations, vaguely defined, yields more varied results.
In the years following the COVID-19 pandemic, many consumers have encountered some combination of complex macroeconomic conditions such as a rapid rise in inflation, increased borrowing costs, rising wages and a reduction in benefits and social supports. Given the rapidly changing economic landscape, it is necessary to consider how individuals perceive theifr own financial well-being, potentially in contrast to their financial well-being scores. This added context is crucial in understanding salient differences across demographic groups and economic circumstances. It may help reveal where gaps between financial well-being as measured by the CFPB’s scale and a respondent’s perceived quality of financial life are greatest, adding to the overall understanding of the relationship between validated scales and individual feelings.
Demographic Breakdown of Quality of Financial Life
Asking individuals to rate the quality of their financial life allows us to capture how a person is feeling about their current financial life in relation to their expectations. We have asked this question as part of our annual Financial Well-Being survey for the past three years, with surveys in December 2021, December 2022, and January 2024.
Our analysis shows that respondent perception of the quality of their financial life became more polarized between December 2021 and January 2024 across several demographics. More respondents reported their financial life to be “worse than” or “better than” than “about what” they expected it to be.
This trend toward more extreme answers can be seen in a breakdown by household income where respondents with lower household incomes report higher instances of having a “worse than expected” quality of financial life. For example, respondents with household incomes under $30,000 a year who reported a “worse than expected” quality of financial life increased from 33% to 41% between late 2022 and early 2024, despite only a 3% jump from late 2021 to late 2022. However, this demographic is also reporting an increase in quality of life that is “better” than what they expected, rising from 11% in late 2021 to 15% in early 2024. Respondents with household incomes at or above $100,000 are the only group who see an increase in reporting a “better” quality of financial life, while all other respondents report their financial life being “worse than expected” at higher rates. Individuals who are not in the top household income bracket are struggling, and even those in the top bracket report their quality of financial life as “worse than expected” at increasing rates.
When comparing the financial well-being scores of different races and ethnicities to their perceived quality of financial life, the differences are profound. While the financial well-being scores between racial and ethnic groups are not identical, there is no significant difference within each racial or ethnic group across years. Black, Hispanic, White, and Asian Americans all maintain stable financial well-being scores across the two surveys.
Asking respondents about the quality of financial life yields significantly different results. Racial and ethnic groups are experiencing much larger swings in their feelings surrounding their financial life, despite their financial well-being scores remaining stable. Although Asian Americans and Pacific Islanders make up a smaller percentage of our sample, resulting in higher margins of error, the stark differences seen remain statistically significant. In our December 2021 sample, 9% report a quality of financial life that is “better than expected” (Error: +/- 5.31%), jumping to 37% in December 2022 (Error: +/- 13.76%) and back to 8% in January 2024 (Error: +/- 4.38%). There are factors at play affecting different demographics’ perceptions of how their financial life is, relative to their expectations, that the financial well-being score does not capture. While respondents are maintaining a relatively stable level of financial well-being, their perception of how their financial life is going is quite different.
We see similar trends with levels of educational attainment, with a few outliers. In general, most respondents are trending toward the more oppositional answers, regardless of their level of education. Across all three years, respondents with professional degrees were the most likely to report a better quality of life, followed by those with bachelor's degrees. These respondents are also the least likely to report a financial life that is “worse than expected,” suggesting that their education is resulting in higher earning potential, which can lead to an increase in quality of financial life. Adults with a bachelor’s degree earn an average of $2.8 million during their careers, which is $1.6 million higher than adults with only a high school diploma, and the median lifetime earnings continue to increase with higher obtained education. Respondents with some college education, an associate degree or vocational degree are among the most likely to report a worse financial life and are the least likely to report a “better” financial life. Those who have some college education without completing their degree may be handling the cost of higher education without the benefits associated with a degree or may be facing external barriers that have impacted their ability to complete their education and their overall financial life.
Conclusion
Trends toward more polarized feelings surrounding the quality of their financial lives might suggest that households’ experience of macroeconomic conditions, in addition to the national discourse regarding the path of the post-Covid recovery, may have contributed to a clearer positive or negative assessment of their financial lives, even if their financial well-being as measured by the CFPB’s scale remained consistent. In general, a higher percentage of respondents reported a worse financial life than better, and the average financial well-being score for those respondents remained stable across the late 2022 and early 2024 surveys, which was at the lower end of the “medium low” level as defined by the CFPB. In contrast, those with a better financial life than expected had financial well-being scores in the “high” range. However, when assessing across demographics, groups maintained consistent financial well-being scores, while experiencing large fluctuations in perceived quality of financial life.
There is a clear connection between perceptions of individual quality of financial life and scorable, subjective financial well-being. There is also a disconnect over time as different demographics experience larger swings in feelings surrounding their financial life while maintaining stable financial well-being scores. Validated scales and individual perspectives are both crucial pieces of the wider financial well-being picture and point to the myriads of factors that play into an individual’s feelings about their own financial lives. It is important to take a nuanced approach to both and understand the importance of both a consistent, validated scale measure, and how individuals are feeling about the quality of their financial life. NEFE’s Scale Validation Project illuminates the need for validation for both current scales in the field and those created in the future, while the Personal Finance Ecosystem highlights the importance of taking a multifaceted approach to financial well-being rather than relying on a single metric to determine overall financial well-being.